

Successful business outcomes rely on amazing data. But when almost every interaction generates data, it’s easy to get overwhelmed by the sheer volume of information.
How do you separate the “good” data from the bad? And once you distill the good data, how do you turn it into actionable insights and business initiatives?
Easy. You take your data out of one-dimensional Excel and comma-separated values (CSV) files and transform it into rich visualizations, interactive dashboards, and in-depth reports.
How Power BI supercharges your data analytics
Microsoft Power BI is a business intelligence and analysis tool that lets users chart progress, compare data points, and make data-backed business decisions based on information gathered from 1 or more data sources.
The beauty of Power BI is that it can be used for many different data-driven use cases. In particular, it can:
Analyze large amounts of data.
Big data is king in modern businesses, especially those that analyze thousands—even millions—of columns or rows of data.
Power BI transforms all that data into a scalable, easy-to-understand format that can’t be found in an Excel spreadsheet. Power BI can also manage real-time data streaming, such as usage metrics, social media feeds, factory sensors, or other sources that generate data.
Build powerful data visualizations.

Spreadsheets have their place. However, if you want insights into data trends, performance metrics, and overall progress, visualizations will tell the whole story around your data.
Power BI provides standard visualization options, such as bar graphs, line charts, scatter plots, and pie charts, with customizable components like color, axis orientation, size, and labels.
Additionally, some Power BI visualizations are powered by artificial intelligence that easily spots trends and anomalies in large quantities of data.
Interact with your data.
Your data has a story to tell. And that story is more compelling if it looks at your data from many different angles.
Case in point: Power BI lets you interact with your data and uncover hidden insights by drilling down into the details, filtering it by values, and slicing it into highly targeted segments.
Share your insights.
Collaboration and communication are critical in driving successful business outcomes. By using OneDrive file sharing with Power BI, you can share reports, dashboards, workspaces, or apps with other stakeholders. Essentially, everyone benefits from your visualizations and data insights.
Power BI also lets users embed interactive reports and visualizations into web, desktop, or mobile apps, giving the right people access to the data they need, all in one place.
Track your data over time.
But there’s another important metric you should track: how data changes over time.
With Power BI, you can publish a report and refresh it regularly, providing a dynamic view of metrics such as time intelligence comparisons and year-to-date performance changes.
Importing and connecting OneDrive files to Power BI
Now that you know why Power BI is an essential tool for uncovering and sharing insights from your data, let’s take a look at how to connect Power BI to all of your valuable data currently housed in Excel and CSV files in OneDrive.
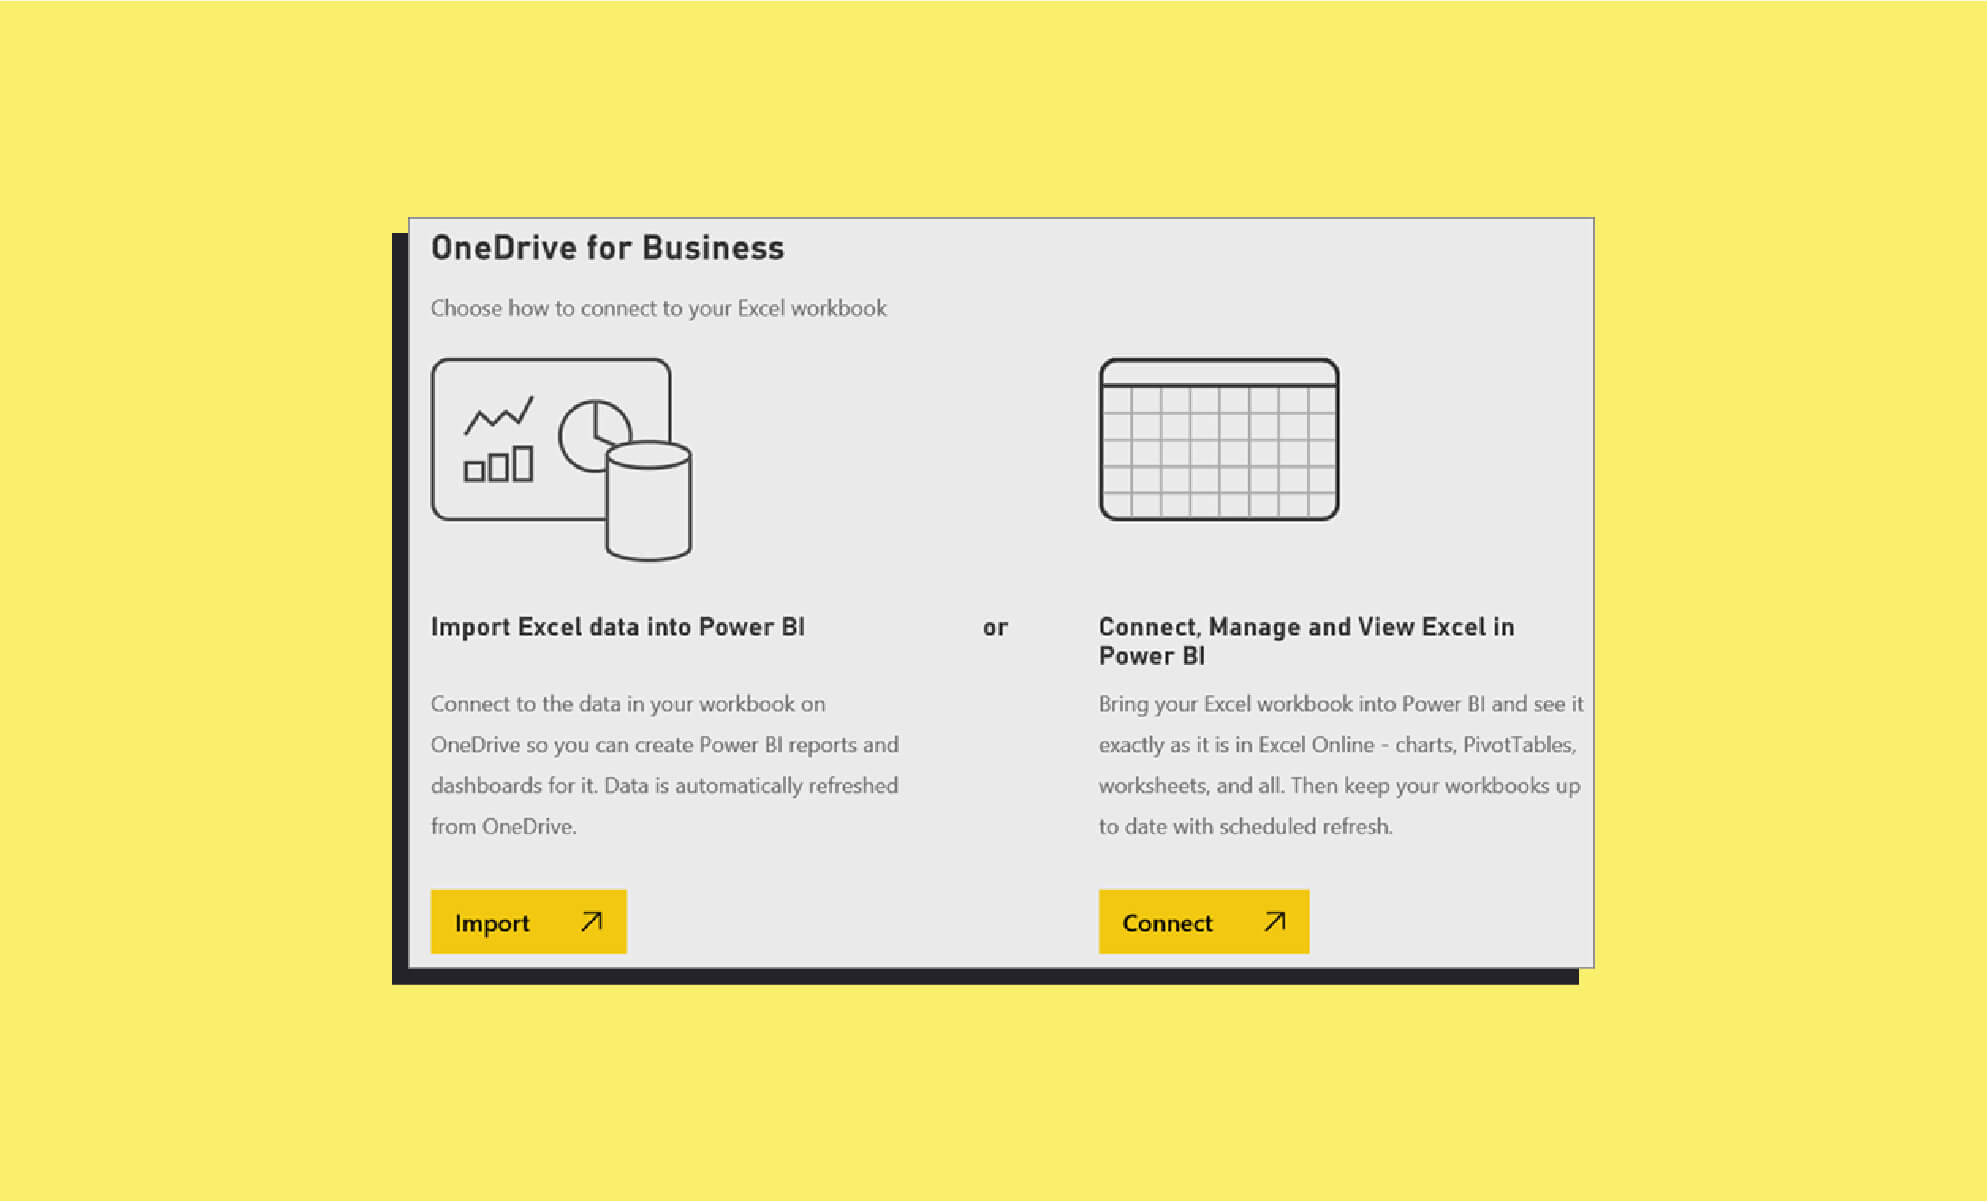
Choosing to import files or connect files to Power BI provides two different functionalities.
First, importing files from OneDrive lets you create Power BI reports for the data in the workbook. This approach makes querying faster, and because the data automatically refreshes from OneDrive, the files in Power BI are always up to date.
Second, connecting files to Power BI brings the workbook into the Power BI application, so you see the data exactly as it is in Excel. You can then use Power BI to analyze the data and create reports. However, the data does not refresh automatically from OneDrive, so plan to refresh manually.
Steps to import or connect files in Power BI
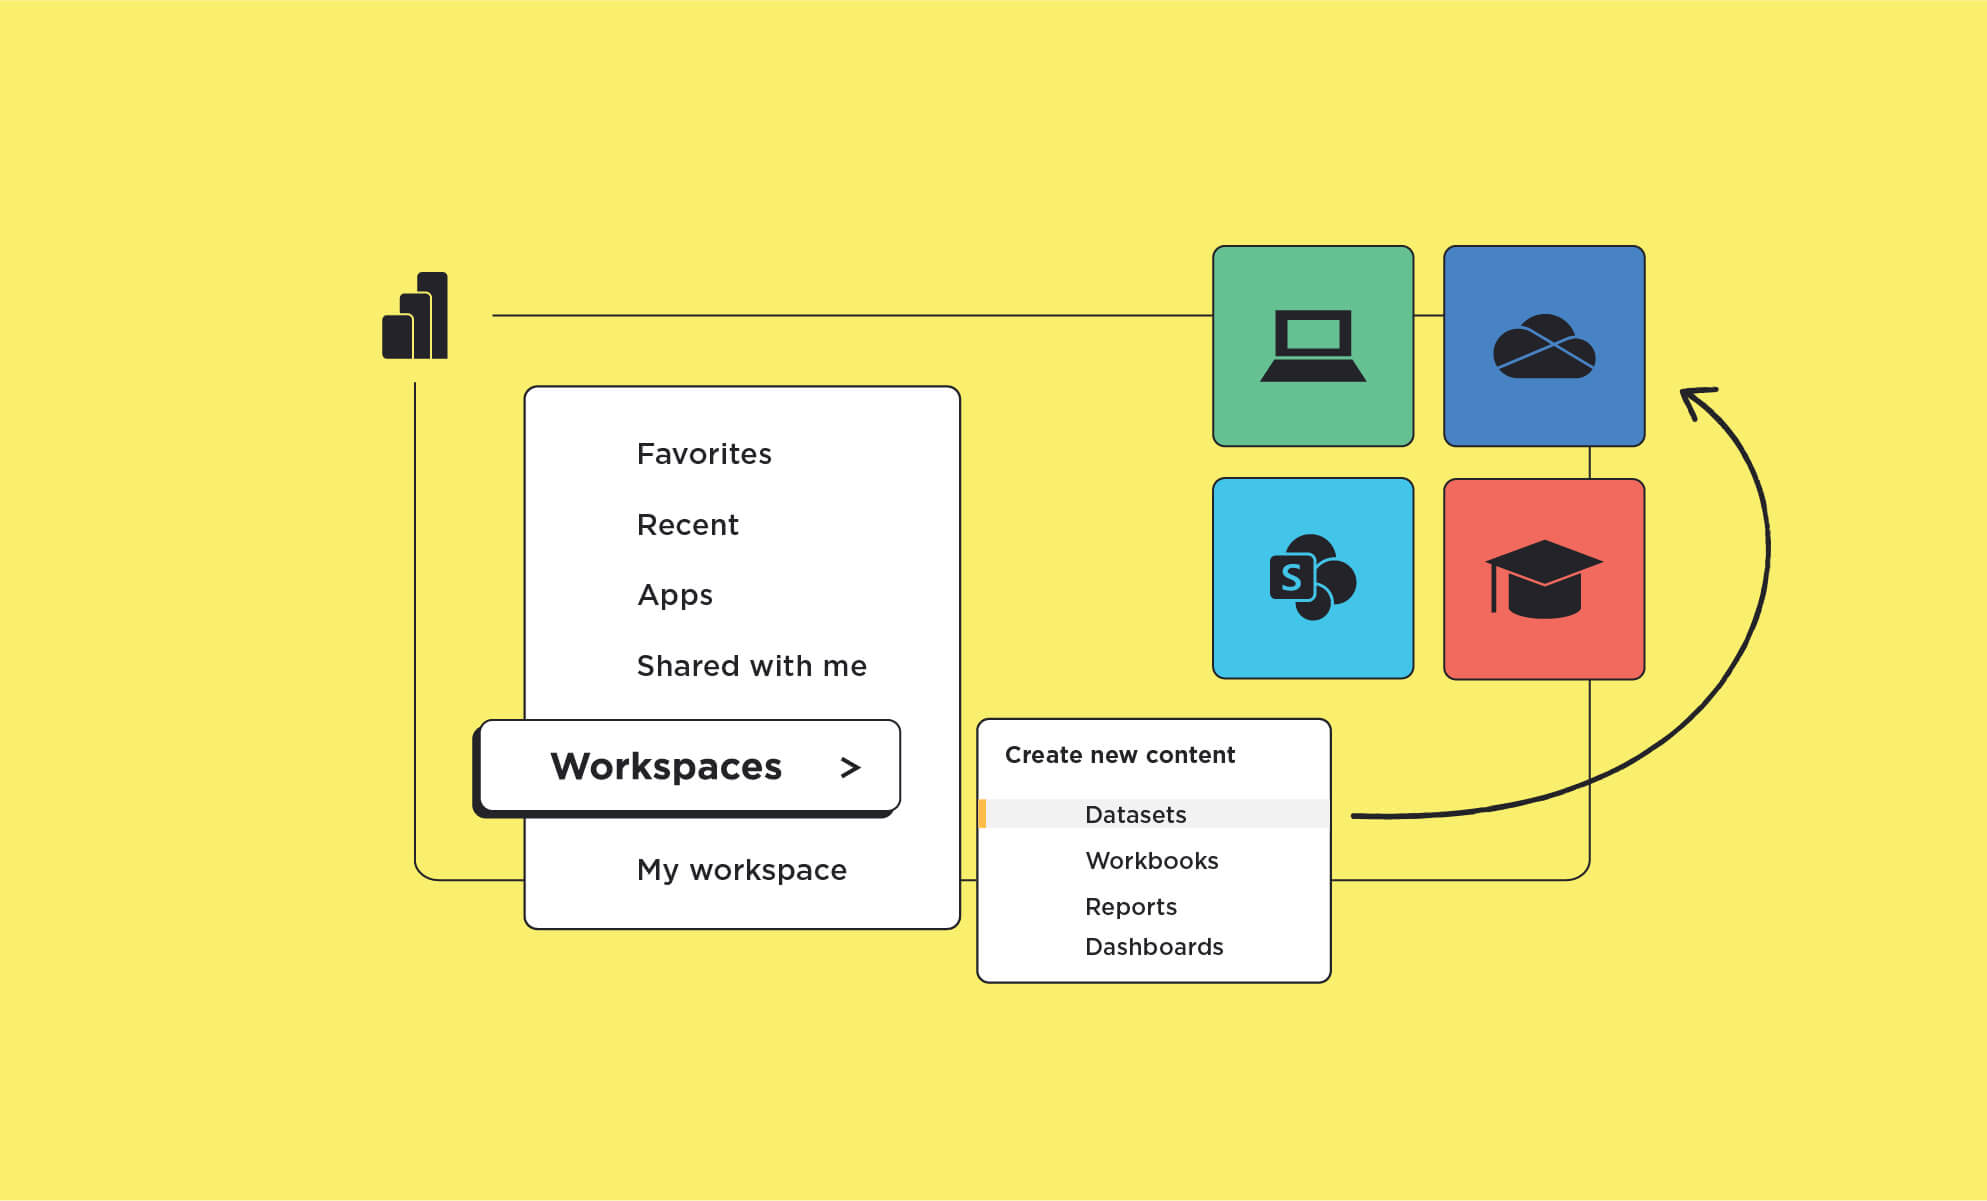
- To get started, log in to Power BI and select Get Data.
- In the Files menu, select Get.
- Select OneDrive for Business, then find and select the Excel or CSV file you would like to import or connect to Power BI.
- Click Connect.
- At this point, decide whether you will import or connect the OneDrive file to Power BI.
To import the Excel or CSV file, select Import. Imported workbooks will appear on the Datasets tab.
When you import files into Power BI, supported data in tables and models will be imported into a new dataset, and Power View sheets will be reconfigured as reports.
After saving changes, the files, reports, and dashboards will auto-sync within an hour. You can also manually update by clicking Publish.
If you opt to connect your OneDrive file to Power BI, select Connect and look for your workbook on the Workbooks tab.
When you connect OneDrive Excel files to Power BI, your workbook will look exactly the same as it does in Excel Online.
Connected workbooks can’t be edited directly in Power BI, so if you need to make changes, click Edit, make changes in Excel, and save. The changes you make in Excel will also save to OneDrive.
Although the steps are simple, importing or connecting your data to Power BI opens up numerous ways to gain valuable insights and increase understanding of even your most complex data sets.
If you want to learn more ways Power BI and OneDrive can empower your data analytics capabilities, check out how BrainStorm drive Microsoft tool adoption.
Want to see how it works? Schedule a demo:
